
How much do Compressed Air Leaks cost?
Ultramax Systems on 15th Oct 2026
Short answer: Compressed air leak cost depends on hole size, line pressure, running hours and your electricity tariff. Using US Department of Energy leak data, a single 3 mm leak at about 7 bar(g) can waste around 2.9 kW, or roughly $5,100 a year at 0.30 AUD/kWh over 6,000 hours. Leakage of 20 to 30 percent of output is common in industrial plants.
How leaks waste money
A leak is air you paid to compress that does no useful work, and compressed air is an expensive utility to begin with. The Australian Government (n.d.) notes that compressed air systems can use up to 30 percent of a site's electricity, and that much of that energy is lost through leaks, even in new equipment.
Leaks are also widespread. Losses of 20 to 30 percent of compressor output are common in industrial plants (Compressed Air Challenge n.d.), and poorly maintained systems typically sit in the same range (US Department of Energy 2016). In Australia, the NSW Office of Environment and Heritage (2017) puts typical losses higher still, at 25 to 45 percent. The encouraging news is that a proactive repair programme can bring leakage below 5 to 10 percent of output (US Department of Energy 2016).
The electricity bill is only part of the cost. Leaks pull down system pressure, so air tools and equipment work less efficiently. They also make compressors cycle more often, which shortens equipment life (US Department of Energy 2016). In other words, a leaky system costs more to run and wears out faster.
Where leaks are usually found
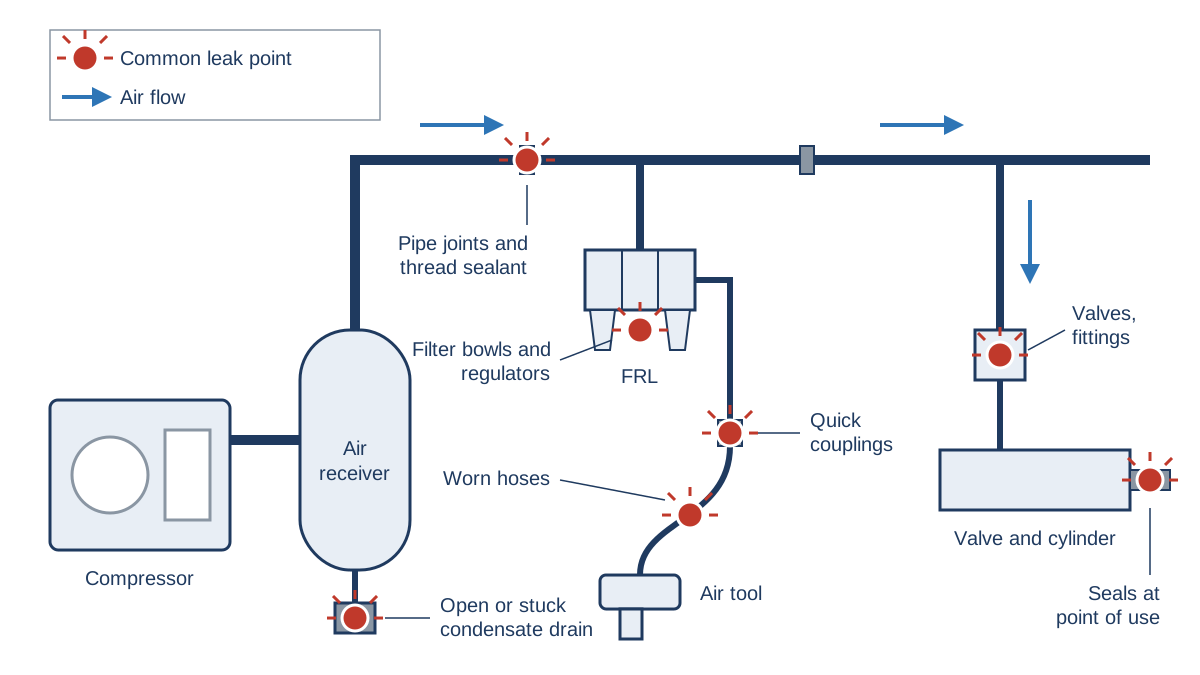
According to the US Department of Energy (2016), most leakage occurs at the point of use, not in the main distribution piping. That narrows the search, because it points to the fittings and components that move, wear or get disconnected in daily use. Common leak points include the following (US Department of Energy 2016):
- Couplings, hoses, tubes and fittings
- Pressure regulators and filter, regulator, lubricator (FRL) units
- Open condensate traps and shut-off valves
- Pipe joints, disconnects and thread sealants
Wear adds to the list. Worn actuator and solenoid seals, damaged fittings mounted low on machines and badly seated valve manifold gaskets are frequent causes (NSW Office of Environment and Heritage 2017). Condensate drains deserve attention too, because a drain left open vents air continuously. For an alternative, see How does a zero air loss drain work?
Leak flow and cost by hole size
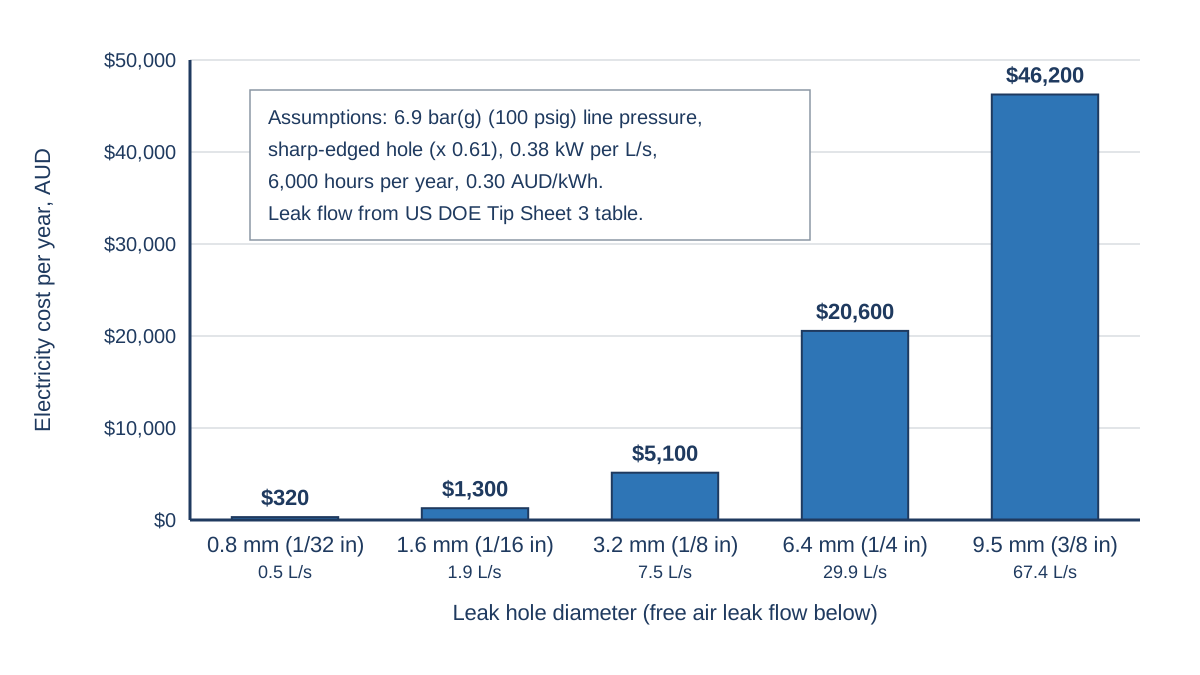
Leak flow rises steeply with hole diameter, because flow follows the area of the opening. Doubling the diameter roughly quadruples the flow, so one large leak can outweigh dozens of small ones. The figures below come from the US Department of Energy (2000) leak table for 100 psig (about 6.9 bar(g)), multiplied by 0.61 as the tip sheet advises for sharp-edged holes. We then converted flow to power and annual cost using the assumptions in the worked example.
| Hole diameter | Leak flow (free air) | Compressor power | Cost per year (AUD) |
|---|---|---|---|
| 0.8 mm (1/32 in) | 0.5 L/s | 0.18 kW | about $320 |
| 1.6 mm (1/16 in) | 1.9 L/s | 0.71 kW | about $1,300 |
| 3.2 mm (1/8 in) | 7.5 L/s | 2.85 kW | about $5,100 |
| 6.4 mm (1/4 in) | 29.9 L/s | 11.4 kW | about $20,600 |
| 9.5 mm (3/8 in) | 67.4 L/s | 25.7 kW | about $46,200 |
Worked example: one 3 mm leak
To estimate the cost of a single leak, multiply its flow by the compressor's specific power, the hours the system stays pressurised and your electricity tariff. The steps below work through a 3 mm (1/8 in) hole. Replace the assumptions with your own figures to get a result for your site.
Assumptions:
- Line pressure about 6.9 bar(g) (100 psig) and a sharp-edged hole (factor 0.61) (US Department of Energy 2000).
- Specific power of 18 kW per 100 cfm, the tip sheet's working figure (US Department of Energy 2000). That converts to about 0.38 kW per L/s (6.4 kW per m³/min).
- 6,000 hours a year with the system pressurised. Leaks flow whenever the air is on, including breaks.
- Electricity at 0.30 AUD/kWh. This is an illustrative assumption only, so use your own tariff.
- Leak flow: 26.0 cfm (table value) × 0.61 = 15.9 cfm. At 0.472 L/s per cfm, that is about 7.5 L/s.
- Power: 7.5 L/s × 0.38 kW per L/s ≈ 2.85 kW.
- Energy: 2.85 kW × 6,000 h ≈ 17,100 kWh a year.
- Cost: 17,100 kWh × $0.30 ≈ $5,100 a year.
Small leaks add up quickly. Twenty 1.6 mm leaks total about 37 L/s, roughly 14 kW, or about $25,700 a year on the same assumptions. As a check, the same method reproduces the dollar figures in the DOE tip sheet when we apply its own inputs (US Department of Energy 2000).
Common mistakes
The most common mistake is to ignore small leaks. They are hard to hear on a busy floor, but they are numerous, and twenty 1.6 mm leaks can cost more than a single 6.4 mm leak. Another is to raise system pressure to cover the losses. Leak flow rises with pressure, so a higher set point simply feeds the leaks (US Department of Energy 2000). Instead, set load pressures to the minimum your equipment needs to work properly, as the Australian Government (n.d.) advises.
Leak management also needs to be ongoing. A one-off survey finds today's leaks, but new ones develop as seals and hoses wear. That is why the NSW Office of Environment and Heritage (2017) recommends in-house leak surveys at least every six months. Finally, finding leaks is only half the job. Tag and log each one, repair it, then re-check to confirm the fix holds.
Key takeaways
- Leakage of 20 to 30 percent of output is common, and 5 to 10 percent or less is achievable.
- Cost scales with hole area, so one large leak can outweigh dozens of tiny ones.
- Estimate cost as leak flow × specific power × hours × tariff, and state every assumption.
- Most leakage sits at the point of use: couplings, hoses, FRLs, drains and fittings.
Frequently asked questions
How do I find compressed air leaks?
Common methods include listening for the hiss, brushing soapy water over fittings and using an ultrasonic leak detector (NSW Office of Environment and Heritage 2017). Ultrasonic detectors sense the high-frequency sound that leaks produce, so they can pick up leaks you cannot hear. Sensor data logs can also reveal unusual pressure drops that point to new leaks (Australian Government n.d.).
How can I estimate my total leak rate?
The US Department of Energy (2016) describes a simple test. With all production equipment off, time how long the compressor runs loaded and unloaded. Leakage (%) = (T × 100) / (T + t), where T is on-load time and t is off-load time.
What leak rate is reasonable?
Well maintained systems can typically keep leaks below 5 to 10 percent of compressor output (US Department of Energy 2016).
Related Ultramax products
- Leak detector spray: find small leaks at joints and fittings.
- Air saving products: zero air loss drains that stop drain losses.
- Quick couplers: replace worn couplings, a common leak point.
- Thread sealing products: reseal threaded joints.
Related reading: What is FAD (free air delivery)?.
References
- Australian Government. n.d. "Compressed Air." energy.gov.au. Accessed 14 October 2026. https://www.energy.gov.au/business/equipment-guides/compressed-air.
- Compressed Air Challenge. n.d. Best Practices for Compressed Air Systems: Introduction. https://www.compressedairchallenge.org/data/sites/1/media/library/best_practices/Introduction.pdf.
- NSW Office of Environment and Heritage. 2017. Low Capital Cost, Simple Solutions to Improve the Efficiency of Your Compressed Air System. Sydney: NSW Office of Environment and Heritage. https://www.energy.nsw.gov.au/sites/default/files/2022-08/2017_NSW_CompressedAirGuidepdf.pdf.
- US Department of Energy. 2000. Minimize Compressed Air Leaks. Compressed Air Tip Sheet #3. Washington, DC: Office of Industrial Technologies. https://nrel.gov/docs/fy01osti/28008.pdf.
- US Department of Energy. 2016. Improving Compressed Air System Performance: A Sourcebook for Industry. 3rd ed. Washington, DC: US Department of Energy and Compressed Air Challenge. https://www.energy.gov/sites/prod/files/2016/03/f30/Improving%20Compressed%20Air%20Sourcebook%20version%203.pdf.
This article is general information only. Check manufacturer documentation and applicable Australian Standards for your installation.